Download Analyzing Data with Microsoft Power BI.DA-100.ExamTopics.2025-10-02.94q.vcex
| Vendor: | Microsoft |
| Exam Code: | DA-100 |
| Exam Name: | Analyzing Data with Microsoft Power BI |
| Date: | Oct 02, 2025 |
| File Size: | 7 MB |
How to open VCEX files?
Files with VCEX extension can be opened by ProfExam Simulator.
Discount: 20%

Demo Questions
Question 1
You have a Microsoft Power BI data model that contains three tables named Sales, Product, and Date.
The Sales table has an existing measure named [Total Sales] that sums the total sales from the Sales table.
You need to write a calculation that returns the percentage of total sales that a selected ProductCategoryName value represents. The calculation must respect any slicers on ProductCategoryName and must show the percentage of visible total sales. For example, if there are four ProductCategoryName values, and a user filters one out, a table showing ProductCategoryName and the calculation must sum up to 100 percent.
How should you complete the calculation? To answer, drag the appropriate values to the correct targets. Each value may be used once, more than once, or not at all. You may need to drag the split bar between panes or scroll to view content.
NOTE: Each correct selection is worth one point.
Correct answer: To work with this question, an Exam Simulator is required.
Explanation:
Box 1: CALCULATE -CALCULATE rvaluates an expression in a modified filter context.Box 2: DIVIDE -As a data modeler, when you write a DAX expression to divide a numerator by a denominator, you can choose to use the DIVIDE function or the divide operator (/- forward slash).When using the DIVIDE function, you must pass in numerator and denominator expressions.Box 3: ALLSELECTED -ALLSELECTED removes context filters from columns and rows in the current query, while retaining all other context filters or explicit filters.The ALLSELECTED function gets the context that represents all rows and columns in the query, while keeping explicit filters and contexts other than row and column filters. This function can be used to obtain visual totals in queries.Example:measure 'Reseller Sales'[Reseller Visual Total]=calculate(sum('Reseller Sales'[Sales Amount]), ALLSELECTED())Reference:https://docs.microsoft.com/en-us/dax/allselected-function-dax Box 1: CALCULATE -
CALCULATE rvaluates an expression in a modified filter context.
Box 2: DIVIDE -
As a data modeler, when you write a DAX expression to divide a numerator by a denominator, you can choose to use the DIVIDE function or the divide operator (/
- forward slash).
When using the DIVIDE function, you must pass in numerator and denominator expressions.
Box 3: ALLSELECTED -
ALLSELECTED removes context filters from columns and rows in the current query, while retaining all other context filters or explicit filters.
The ALLSELECTED function gets the context that represents all rows and columns in the query, while keeping explicit filters and contexts other than row and column filters. This function can be used to obtain visual totals in queries.
Example:
measure 'Reseller Sales'[Reseller Visual Total]=calculate(sum('Reseller Sales'[Sales Amount]), ALLSELECTED())
Reference:
https://docs.microsoft.com/en-us/dax/allselected-function-dax
Question 2
You are using existing reports to build a dashboard that will be viewed frequently in portrait mode on mobile phones.
You need to build the dashboard.
Which four actions should you perform in sequence? To answer, move the appropriate actions from the list of actions to the answer area and arrange them in the correct order.
Correct answer: To work with this question, an Exam Simulator is required.
Explanation:
When you view dashboards in portrait mode on a phone, you notice the dashboard tiles are laid out one after another, all the same size. In the Power BI service, you can create a customized view of a dashboard, specifically for portrait mode on phones.Step 1: Open the Dashboard.Step 2: Change the dashboard view to Phone viewStep 3: Pin items from the reports to the dashboard.Step 4: Rearrange, resize, or remote items from the Phone view.Create a phone view of a dashboard1. In the Power BI service, open a dashboard (Step 1)2. Select the arrow next to Web view in the upper-right corner > select Phone view. (Step 2) The phone dashboard edit view opens. Here you can unpin, resize, and rearrange tiles to fit the phone view. The web version of the dashboard doesn't change.3. Select a tile to drag, resize, or unpin it. You notice the other tiles move out of the way as you drag a tile.The unpinned tiles go in the Unpinned tiles pane, where they stay unless you add them back.4. If you change your mind, select Reset tiles to put them back in the size and order they were before.5. When you're satisfied with the phone dashboard layout, select the arrow next to Phone view in the upper-right corner > select Web view.Power BI saves the phone layout automatically.Reference:https://docs.microsoft.com/en-us/power-bi/create-reports/service-create-dashboard-mobile-phone-view When you view dashboards in portrait mode on a phone, you notice the dashboard tiles are laid out one after another, all the same size. In the Power BI service, you can create a customized view of a dashboard, specifically for portrait mode on phones.
Step 1: Open the Dashboard.
Step 2: Change the dashboard view to Phone view
Step 3: Pin items from the reports to the dashboard.
Step 4: Rearrange, resize, or remote items from the Phone view.
Create a phone view of a dashboard
1. In the Power BI service, open a dashboard (Step 1)
2. Select the arrow next to Web view in the upper-right corner > select Phone view. (Step 2)
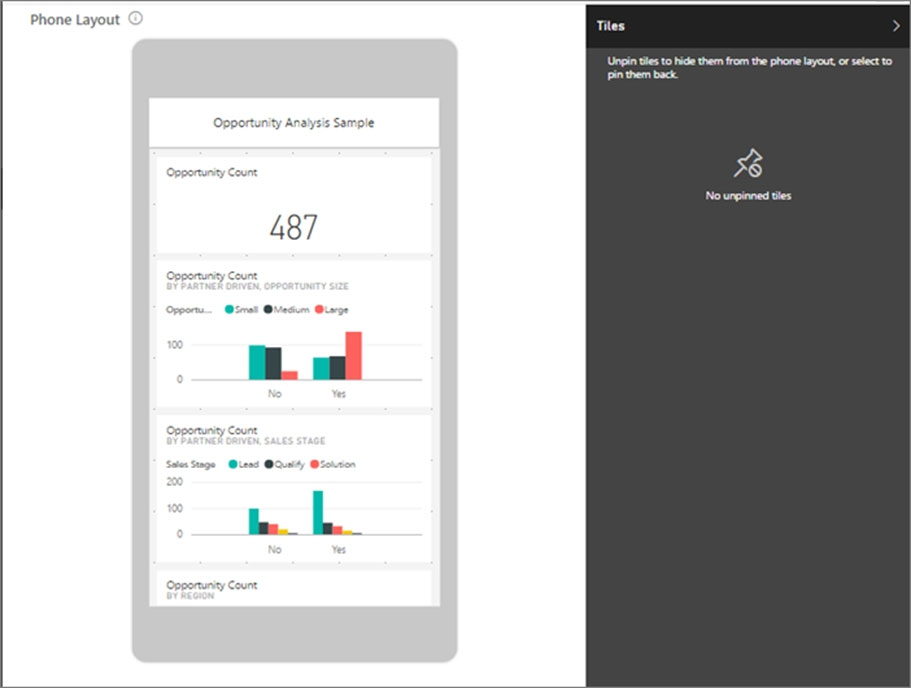
The phone dashboard edit view opens. Here you can unpin, resize, and rearrange tiles to fit the phone view. The web version of the dashboard doesn't change.
3. Select a tile to drag, resize, or unpin it. You notice the other tiles move out of the way as you drag a tile.
The unpinned tiles go in the Unpinned tiles pane, where they stay unless you add them back.
4. If you change your mind, select Reset tiles to put them back in the size and order they were before.
5. When you're satisfied with the phone dashboard layout, select the arrow next to Phone view in the upper-right corner > select Web view.
Power BI saves the phone layout automatically.
Reference:
https://docs.microsoft.com/en-us/power-bi/create-reports/service-create-dashboard-mobile-phone-view
Question 3
Your company has employees in 10 states.
The company recently decided to associate each state to one of the following three regions: East, West, and North.
You have a data model that contains employee information by state. The model does NOT include region information.
You have a report that shows the employees by state.
You need to view the employees by region as quickly as possible.
What should you do?
- Create a new aggregation that summarizes by employee.
- Create a new group on the state column and set the Group type to List.
- Create a new group on the state column and set the Group type to Bin.
- Create a new aggregation that summarizes by state.
Correct answer: B
Explanation:
B: 4 - Mosted B: 4 - Mosted
Question 4
You have a Microsoft Power BI data model that contains three tables named Orders, Date, and City. There is a one-to-many relationship between Date and
Orders and between City and Orders.
The model contains two row-level security (RLS) roles named Role1 and Role2. Role1 contains the following filter.
City[State Province] = "Kentucky"
Role2 contains the following filter.
Date[Calendar Year] = 2020 -
If a user is a member of both Role1 and Role2, what data will they see in a report that uses the model?
- The user will see data for which the State Province value is Kentucky and the Calendar Year is 2020.
- The user will see data for which the State Province value is Kentucky or the Calendar Year is 2020.
- The user will see only data for which the State Province value is Kentucky.
- The user will receive an error and will not be able to see the data in the report.
Correct answer: B
Explanation:
A: 1B: 5 - Mosted A: 1B: 5 - Mosted
Question 5
You have sales data in a star schema that contains four tables named Sales, Customer, Date, and Product. The Sales table contains purchase and ship dates.
Most often, you will use the purchase date to analyze the data, but you will analyze the data by both dates independently and together.
You need to design an imported dataset to support the analysis. The solution must minimize the model size and the number of queries against the data source.
Which data modeling design should you use?
- Use the Auto Date/Time functionality in Microsoft Power BI and do NOT import the Date table.
- Duplicate the Date query in Power Query and use active relationships between both Date tables.
- On the Date table, use a reference query in Power Query and create active relationships between Sales and both Date tables in the modeling view.
- Create an active relationship between Sales and Date for the purchase date and an inactive relationship for the ship date.
Correct answer: C
Explanation:
C: 7 - MostedD: 6 C: 7 - MostedD: 6
Question 6
You are developing a sales report that will have multiple pages. Each page will answer a different business question.
You plan to have a menu page that will show all the business questions.
You need to ensure that users can click each business question and be directed to the page where the question is answered. The solution must ensure that the menu page will work when deployed to any workspace.
What should you include on the menu page?
- Create a text box for each business question and insert a link.
- Create a button for each business question and set the action type to Bookmark.
- Create a Power Apps visual that contains a drop-down list. The drop-down list will contain the business questions.
Correct answer: B
Explanation:
B: 4 - Mosted B: 4 - Mosted
Question 7
You are developing a report page. Some users will navigate the report by using a keyboard, and some users will consume the report by using a screen reader.
You need to ensure that the users can consume the content on a report page in a logical order.
What should you configure in Microsoft Power BI Desktop?
- the tab order
- the layer order
- the bookmark order
- the X position
Correct answer: A
Explanation:
A: 1 - MostedIf you find yourself unable to navigate to an object or visual while using a keyboard, it may be because the report author has decided to hide that object from the tab order. Report authors commonly hide decorative objects from the tab order. If you find that you cannot tab through a report in a logical manner, you should contact the report author. Report authors can set the tab order for objects and visuals.Reference:https://docs.microsoft.com/en-us/power-bi/create-reports/desktop-accessibility-consuming-tools A: 1 - Mosted
If you find yourself unable to navigate to an object or visual while using a keyboard, it may be because the report author has decided to hide that object from the tab order. Report authors commonly hide decorative objects from the tab order. If you find that you cannot tab through a report in a logical manner, you should contact the report author. Report authors can set the tab order for objects and visuals.
Reference:
https://docs.microsoft.com/en-us/power-bi/create-reports/desktop-accessibility-consuming-tools
Question 8
You have a report that contains a bar chart and a column chart. The bar chart shows customer count by customer segment. The column chart shows sales by month.
You need to ensure that when a segment is selected in the bar chart, you see which portion of the total sales for the month belongs to the customer segment.
How should the visual interactions be set on the column chart when the bar chart is selected?
- no impact
- highlight
- filter
Correct answer: B
Explanation:
B: 12 - Mosted B: 12 - Mosted
Question 9
You have a dashboard that contains tiles pinned from a single report as shown in the Original Dashboard exhibit. (Click the Original Dashboard tab.)
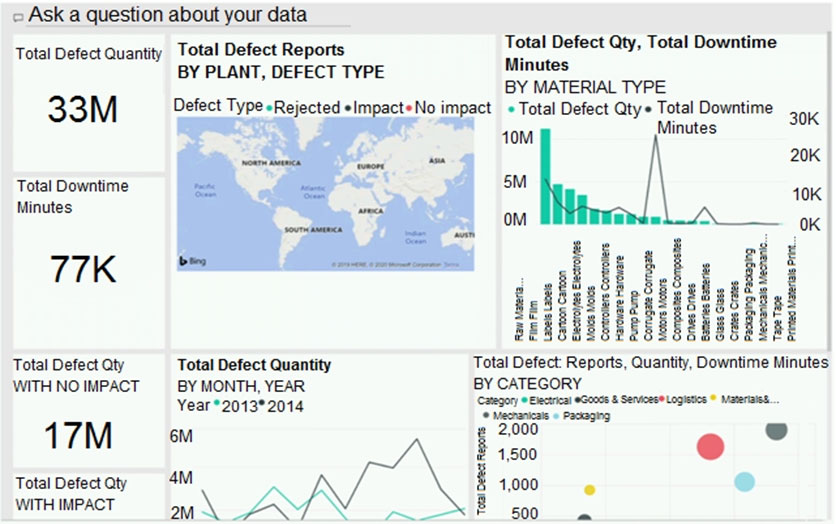
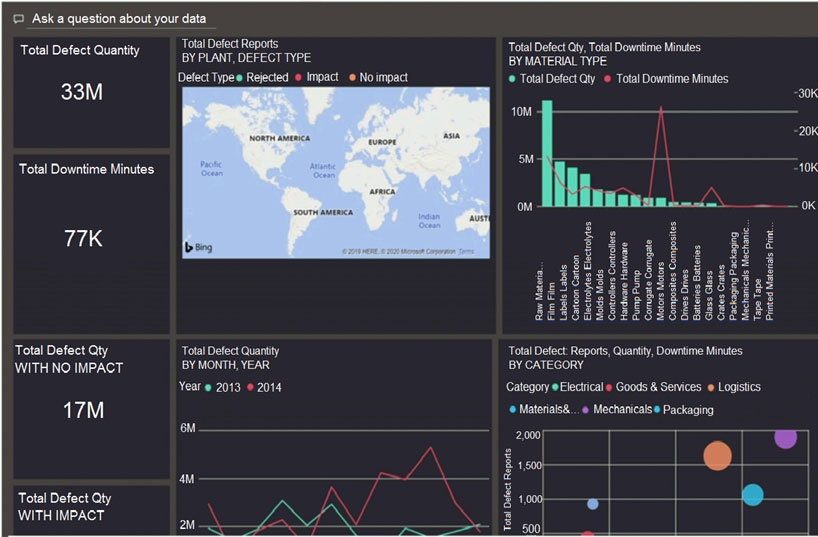
You need to modify the dashboard to appear as shown in the Modified Dashboard exhibit. (Click the Modified Dashboard tab.)
What should you do?
- Edit the details of each tile.
- Change the report theme.
- Change the dashboard theme.
- Create a custom CSS file.
Correct answer: C
Explanation:
B: 9C: 19 - Mosted B: 9C: 19 - Mosted
Question 10
You have a query named Customer that imports CSV files from a data lake. The query contains 50,000 rows as shown in the exhibit. (Click the Exhibit tab.)
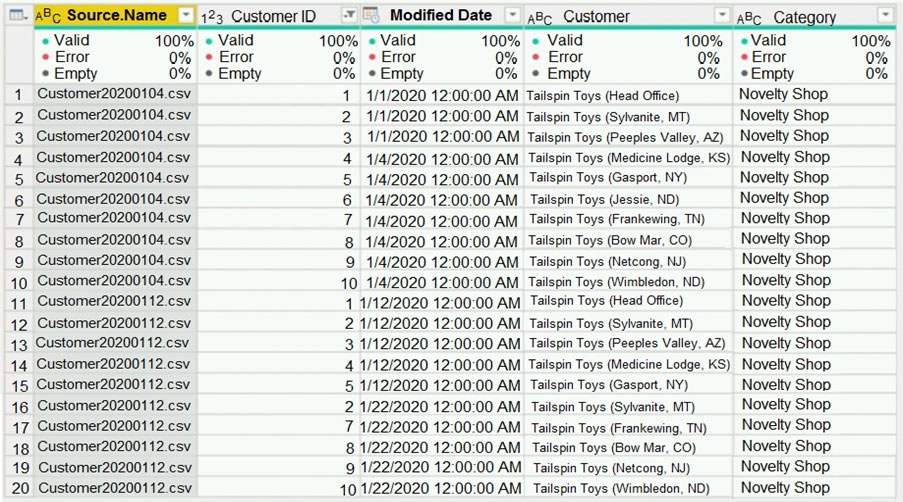
Each file contains deltas of any new or modified rows from each load to the data lake. Multiple files can have the same customer ID.
You need to keep only the last modified row for each customer ID.
Which three actions should you perform in sequence? To answer, move the appropriate actions from the list of actions to the answer area and arrange them in the correct order.
Correct answer: To work with this question, an Exam Simulator is required.
Question 11
You publish a Microsoft Power BI dataset to powerbi.com. The dataset appends data from an on-premises Oracle database and an Azure SQL database by using one query.
You have admin access to the workspace and permission to use an existing On-premises data gateway for which the Oracle data source is already configured.
You need to ensure that the data is updated every morning. The solution must minimize configuration effort.
Which two actions should you perform when you configure scheduled refresh? Each correct answer presents part of the solution.
NOTE: Each correct selection is worth one point.
- Configure the dataset to use the existing On-premises data gateway.
- Deploy an On-premises data gateway in personal mode.
- Set the refresh frequency to Daily.
- Configure the dataset to use the personal gateway.
Correct answer: AC
Explanation:
AC: 3 - Mosted AC: 3 - Mosted
HOW TO OPEN VCE FILES
Use VCE Exam Simulator to open VCE files
HOW TO OPEN VCEX AND EXAM FILES
Use ProfExam Simulator to open VCEX and EXAM files
ProfExam at a 20% markdown
You have the opportunity to purchase ProfExam at a 20% reduced price
Get Now!